
Air pollution
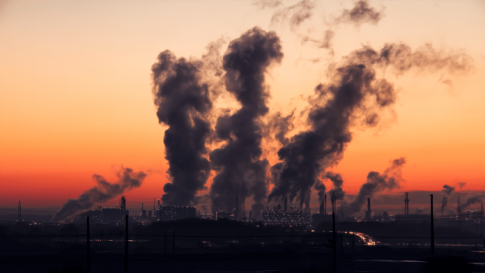


NO₂ is a problem gas that is produced primarily by vehicle exhausts ...
By Jonathan Amos
The animation shows the concentration and movement through the atmosphere of nitrogen dioxide.
NO₂ is a problem gas that is produced primarily by vehicle exhausts and industrial activity via the burning of fossil fuels.
The map covers a sample period from 5 to 10 January, and describes the behaviour of NO₂ at ground level on an hourly basis.
The worst air quality peaks in the white.
This fascinating insight was produced for the BBC by the Copernicus Atmosphere Monitoring Service (CAMS), which is based at the European Centre for Medium-Range Weather Forecasts (ECMWF) in Reading.
To make this type of animation, CAMS incorporates satellite observations and surface measurements.
But as extensive as these data-sets have now become, they don't give a complete, real-time picture.
So, the scientists must also marry the sensor information with models - of how the atmosphere moves and what the weather is doing.
One of the first things you'll notice in the animation is the prevalence of NO₂ emanating from the "usual suspects".
"What you immediately see are the larger cities. You see Madrid, you see Paris, you see Moscow, you see London," explains Richard Engelen, the deputy head of CAMS.
"Then you'll see more industrial areas, like Germany but also in the UK. You'll see too those areas where there are very dense traffic infrastructures, such as the Netherlands and Belgium where you have a lot of traffic from the two main ports at Rotterdam and Antwerp. These are the emission sources that always pop up," he told BBC News.
Notice also the line of emissions streaming away from the Strait of Gibraltar as ships line up to navigate their passage into and out of the Mediterranean; and look at how the two great mountain ranges of Europe, the Pyrenees and the Alps, act as barriers to the movement of pollution.
In northern Italy, the Alps works to trap NO₂ emissions generated in the Po Valley, giving the region among the dirtiest air in Europe.
If the animation demonstrates one thing it is that pollution has no respect for national boundaries.
CAMS' mission is to deliver a continuous flow of data on the quality of the air - and not just for NO₂, but a range of other pollutants (and greenhouse gases).
The service's products will find their way into smartphone apps that the public and businesses can use. And, of course, all the information is made available to policy-makers so they can take steps to clean up the atmosphere.
Vincent-Henri Peuch, the head of CAMS, commented: "We are unique in the world in terms of the observations that we acquire. To deliver the CAMS products, we build on top of all of the observations that are acquired for numerical weather prediction; and the amount of satellite and in-situ data that we get has no equivalent.
"It's a very good example of pulling together resources at a European level in order to provide products that no single country on its own could develop."
Copernicus is an initiative of the European Union.
The British government has stated its desire to continue its involvement in the programme after Brexit.
Under EU law, the average hourly level of NO₂ must not exceed 200 micrograms per cubic metre of air more than 18 times in a year; and the NO₂ annual mean value may must not exceed 40 micrograms per cubic metre.
 del.icio.us |
 Digg
Digg


Post your comment